Between rising energy costs, a softening in Southern California, and a Dallas pipeline that won't quit, the industrial market is sending mixed signals. Here's how Foundation Specialty Finance is thinking about what it all means for borrowers.
Iran Conflict Ripples Through Industrial
■ The ongoing conflict in Iran and the disruption to shipping through the Strait of Hormuz are starting
to impact global logistics costs and supply chains.
■ The energy shock is the most immediate and consequential disruption. Before the conflict, about 20% of global oil supply moved through the Strait of Hormuz, and the effective shuttering of the strait has been perhaps the largest shock ever to the global oil market. Gasoline, jet, and maritime fuel prices have all risen sharply, increasing shipping costs at every point along the supply chain. Damage to refining facilities in the region raises questions about how quickly energy markets will stabilize once the conflict ends.
■ For the industrial sector, higher transportation costs will increase the value of the location. Occupiers will place more emphasis on reducing delivery distances and keeping inventory closer to customers. This situation played out when supply chain bottlenecks became common as a result of the pandemic, and while many firms have improved the resilience of their supply chains in the intervening years, we anticipate that site selection will once again become a primary driver of
leasing decisions. Infill facilities, properties adjacent to seaports, rail hubs, and highway networks are best positioned as firms look to offset increased shipping costs.
■ Higher fuel and shipping costs are not the only avenues through which the conflict will impact the industrial sector, as ripple effects will reach across global supply chains. The Gulf is a key exporter of many industrial inputs, including petrochemicals, fertilizers, and helium. Disruptions to production of these inputs are tightening supply globally, increasing costs for everything from plastics and agricultural products to computer chips and advanced manufacturing. Meanwhile,
bottlenecks are increasing, vessels are rerouting, and insurance premiums for cargo are rising.
■ If the conflict continues into the summer or beyond, higher energy costs, longer shipping times, and a tighter supply of many industrial inputs will all become embedded in the global economy. The post-pandemic period of turmoil began the regionalization of supply chains, and this current disruption may accelerate it. Higher energy costs will also act as a drag on consumer spending, which could dampen the demand for goods. E-commerce has been the largest driver of industrial
leasing, and a slowdown in consumer spending could reduce warehouse demand for distribution and fulfillment space.

Rents and Occupancy:
Softness in Southern California
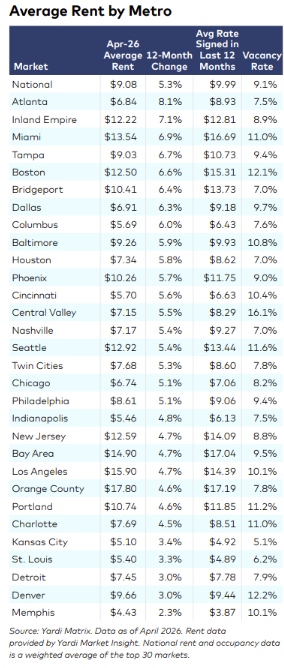
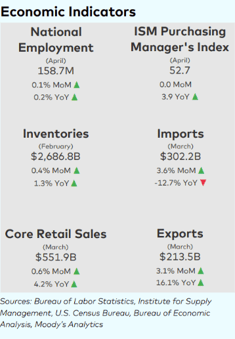
■ National in-place rents for industrial space averaged $9.08 per square foot in April, up five cents over the previous month and 5.3% over the past 12 months.
■ Atlanta continues to lead top markets for inplace rent growth, with rates increasing 8.1% in the past 12 months. It was followed by Inland Empire (7.1%), Miami (6.9%), Tampa (6.7%), and Boston (6.6%).
■ The lowest in-place rent growth was in Memphis (2.3%), Denver (3.0%), Detroit (3.0%), St. Louis (3.3%), and Kansas City (3.4%).
■ The national vacancy rate was 9.1% in April, up 30 basis points over the past year. Vacancies have generally plateaued since the second half of last year, as deliveries have leveled off and demand remains solid but unspectacular.
■ Leases signed in the past 12 months averaged $9.99 per foot, 91 cents above the national average for in-place rents. The national spread has narrowed in recent quarters, and in many markets, newly signed leases are now slightly below prevailing market averages, indicating that negotiating leverage has shifted back toward tenants. Southern California illustrates this trend. Los Angeles and Orange County had tight vacancies and red-hot rent growth in the recent past, but now find new leases priced at less than the inplace averages. In Los Angeles, leases signed within the past year were $1.51 per square foot lower than the market average, while in Orange County, they were $0.61 lower. We do not anticipate this dynamic to persist, however. The supply boom in Southern California has subsided, and space for new development is more limited than it was at the start of the decade. At the same time, the Ports of Los Angeles and Long Beach remain the busiest in the country, supporting long-term demand.
Supply: Dallas Pipeline Remains Large
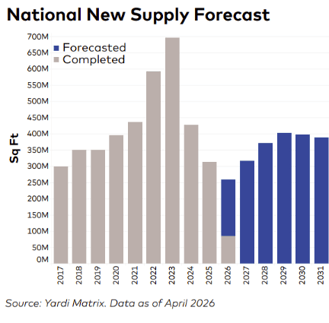
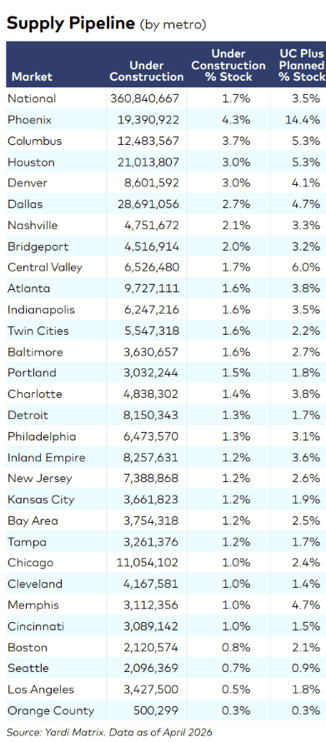
■ Currently, 360.8 million square feet of industrial space (1.7% of stock) are under construction.
■ Dallas continues to outpace every other market when it comes to industrial supply. A total of 28.6 million square feet of space is currently underway, representing 2.7% of stock. This is notable in the context of how much new space has been delivered in recent years. In 2022 and 2023, Dallas delivered a staggering 116.8 million square feet (11.1% of stock) of industrial space, and added another 51.6 million square feet between 2024 and 2025. This supply surge pushed up the market’s vacancy rate to 9.7%, but demand in the region remains solid, and developers remain bullish on Dallas’ long-term fundamentals.
■ Unlike many markets, Dallas saw a start increase in 2025. The metro’s 28.0 million square feet of new development led the U.S. last year and slightly eclipsed Dallas’ 2024 total of 24.7 million square feet. The market benefited from strong demographic growth, and its location makes it a prime hub for goods imported from Mexico. A renewal of the United States-Mexico-Canada Agreement (USMCA) could drive even more activity in the supply pipeline.


Economic Indicators:
Energy Costs Drive Spike in Producer Prices
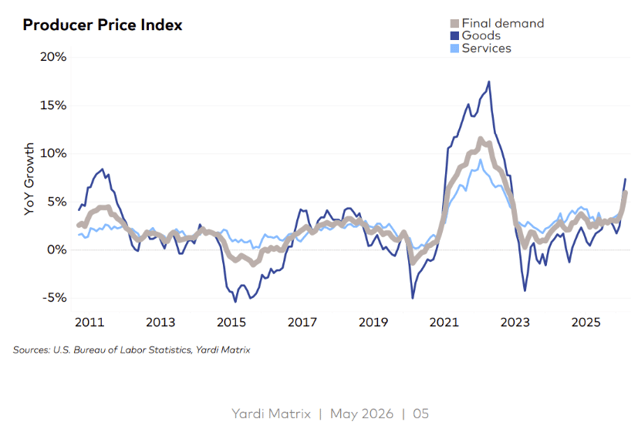
■ Producer price increases hit a four-year high in April, according to the U.S. Bureau of Labor Statistics. The Producer Price Index (PPI) grew 1.4% in April, the largest monthly gain since March 2022, and 6.0% year-over-year, the biggest annual increase since December 2022. The goods portion of the PPI jumped 2.0% during the month and 7.4% year-over year, while the services portion increased 1.2% monthly and 5.5% annually. More than 75% of the gains were driven by a 7.8% increase in the cost of energy.
■ The PPI, which measures changes in selling prices received by producers for goods and services, is a leading indicator for the more widely followed consumer index. During the wave of inflation that occurred between 2021 and 2023, the trend in the PPI generally ran two to three months ahead of the CPI. Higher producer prices may not be fully passed onto the consumer, however, as high energy prices will cut into consumer spending, lowering demand for consumer goods and decreasing firms’ pricing power.


Transactions:
Philadelphia Active to Start Year
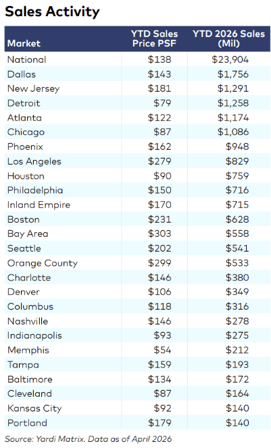
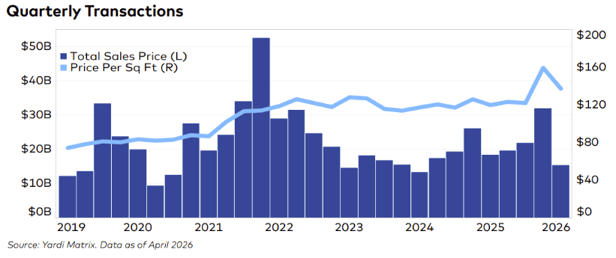
■ Yardi Matrix logged $23.9 billion in industrial transactions through April, with properties trading at an average of $138 per square foot.
■ The average sale price of an industrial property in Philadelphia has grown more than 150% between 2019 and 2026, one of the highest rates of increase in the country. Strong demand for logistics space, a densely populated area, and an efficient port have driven investor appetite for local assets. Since the start of 2021, 67.7 million square feet (13.9% of stock) of industrial space have been delivered in the market. While this has pushed some vacancy rates upward, much of the new supply has been absorbed. Philadelphia’s current vacancy rate is 9.4%, a figure we anticipate will tick down in the coming months, as just 6.5 million square feet are under construction.
■ EQT Real Estate has been remarkably active in South Jersey over the past several quarters. After paying more than $100 million for a five-property portfolio in late 2025, the firm spent $308.7 million to acquire the 2 million square-foot Forest Park Corporate Center in Gloucester County. The park counts Amazon and DHL among its tenants, and EQT plans to make targeted capital improvements to some of the buildings.